In Linux simply you need to enter some commands to get the CPU, Disk, Memory Usage by the system. The very first thing to keep in mind while searching ways to check usage or consumption of your Linux system resources is whether you are trying to find about cpu usage, ram usage, memory usage or simply your hard disk usage. Different from the common assumption, all of these things completely vary from each other.
CPU Usage in Linux is the percentage of cycles carried on by your central processing unit as compared to the maximum number of cycles allowed i.e. its maximum efficiency per se. Linux CPU Usage is calculated by the percentage of cycles done in last second to the maximum number possible. For example, if you have a 2.2Ghz CPU which has carried out 1,100,000,000 cycles in the last second then its usage will be measured at 50%.
Linux Memory usage is typically the percentage to which your ram is used as compared to the full size of it. Supposedly, you have a ram 4GB in your system out of which only 1GB is being used at the present, in this case your Memory Usage of Linux will come at 25%.
Hard Disk Usage in the Linux is same as I/O usage. As you would have guessed, its the memory and resources consumption of hard drive by the programs and hardware you are currently running on your Linux System. Disk Usage in Linux determined by the percentage of resources allocated as compared to maximum allocation allowed. If you have a 1TB hard drive out of which you are only able to put the use of 100GB of space then Disk Usage of your Linux will be measured at 10% of the total.
In Linux, unlike Windows, there are multiple scripts and commands to measure the disk usage, memory usage and cpu usage of your system. We will be covering separate sections on how to check the usage for each of CPU, RAM, Hard Disk.
Contents
How to Check Disk Usage on Linux?
There are some commands as well as several apps to view the disk usage consumption in Linux Operating System.
Command Line Tools
The very basic step to analyze the number of disk resources utilized is via the command line interface. Linux provides some built-in commands for the very same purposes which not only let you view and analyze the details related to disk usage but do a lot more. There are mainly two commands provided for this purpose within Linux interface.
- df
- du
- ls
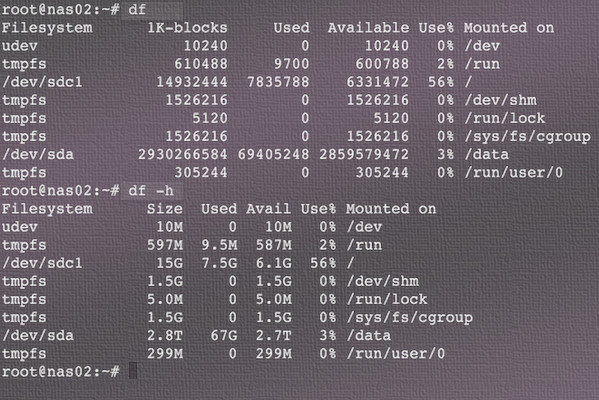
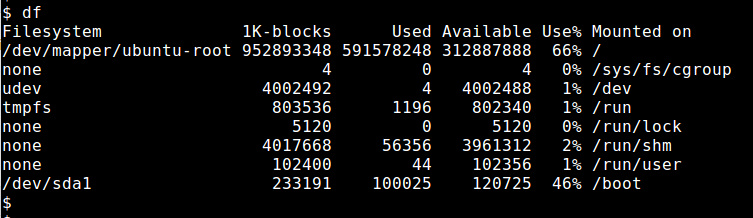
‘df‘ command can be used to report the total amount of disk space in use in any Linux System. When used with the filename, it displays the free space on the specific partition where that file is stored.
When used alongside with -h attribute, it displays the files and folder lists in a readable format which can be then used to calculate the available disk space. A complete list of df command functions and attributes can be found here.
‘du‘ is another command for Linux Terminal, which is used for disk usage related purposes. It’s slightly different than the df command as instead of showing available space, it shows the space already consumed by files in the disk. It also has various attributes and functions which you can read about here.
ls is another rather simple Linux command which can be used to list a directory’s contents with the corresponding file size of each.
ls -l -h
Above exact command can be used for the same purposes.
Ncurses Disk Usage
If you are one of those not so tech savvy ones who prefer an app or utility for every function you need to perform on your Linux then ncdu (ncurses disk usage) is your best bet. About as simple as it can get, this tool as soon as launched performs a quick scan of your Linux System and displays content and usage of a home directory as specified by default, though it can be changed by applying specific attributes and specifying certain perimeters.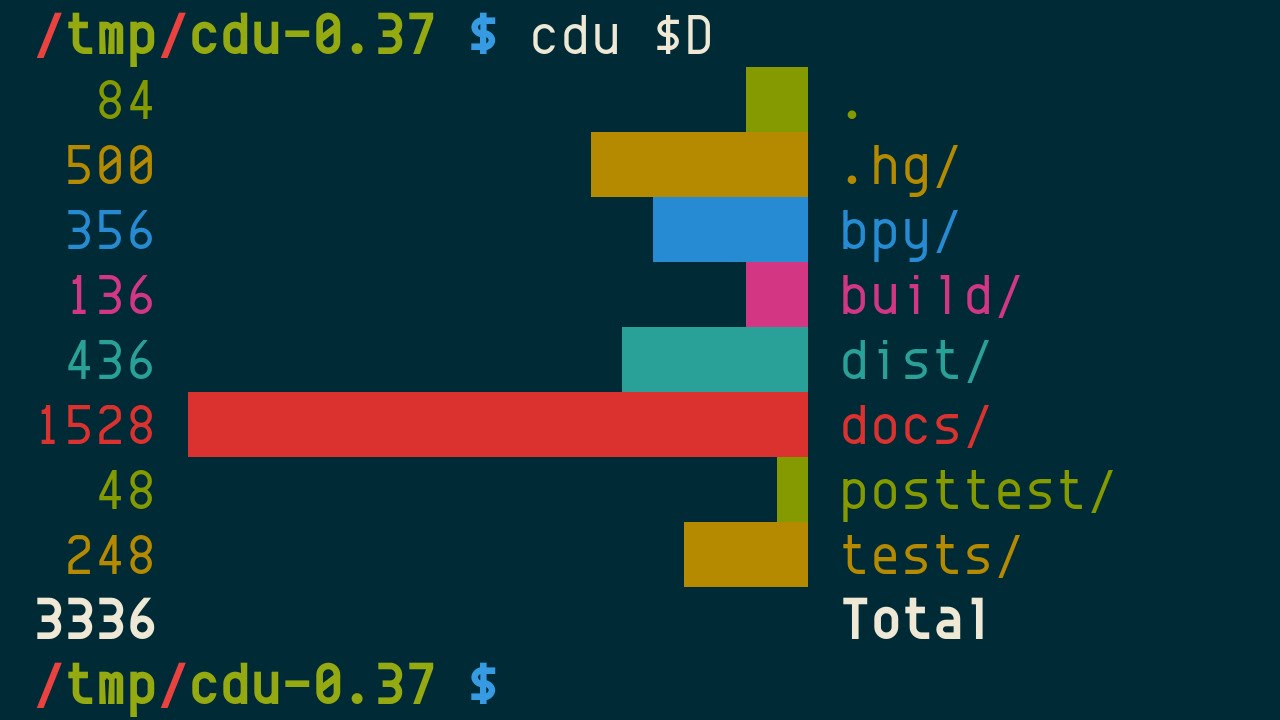
It can be simply installed via this specific command on debian based systems.
sudo apt install ncdu
For further usage instructions and list of features, head over to the official page.
It consists of various another nifty handful of features such as toggling hidden items visibility, sorting by name & size, deletion of files & folders amongst others on Linux OS.
QDirStat
It was the very first visual disk usage analysis tool which was available across Linux Desktop environments. For various insight related purposes, visual tool serves a better purpose than a list of name and numbers for obvious reasons.
Such tools are a great way to find missing downloading locations, background hidden downloading. You can get it via github.
Disk Usage Analyzer
Primarily named as Baobab, it’s another visual tool for disk analyzing for Linux PCs. It offers a radial treemap pie chart instead of a block-based display of QDirStat.
It offers color coding for better access and understanding but is limited to that only. It doesn’t offer much in terms of functionality and features.
xDiskUsage
It’s another visual disk analyzer tool developed specially for Linux, which is known for its simplicity. It works vis the du command.
It can be installed in Debian based systems via this command.
sudo apt install xdiskusage
Afterward, run the xdiskusage command and then select the directory to analyze which will result in a tree structure presentation. You can further navigate it easily and print a graphic display if needed.
Duc
It’s another visual tool with radial treemap based display.
You can download the code via its website and compile it. For Debian based Linux distros, you can use the below.
sudo apt install duc
You can check the website for further usage and installation instructions as well.
What sets Duc apart is that it maintains a database of the disk’s contents thus making it ideal for regular usage and for heavy systems with larger storage.
JDiskReport
It’s a java based tool which enhances it to run on older versions of Linux as well. After analysis, it displays data statistically as well as in charts and tables.
It’s tough to update but comes with better reporting options than all the above.
Read Also:
- What is WMI Provider Host? – Fix High CPU & Disk Usage in Windows
- Windows Modules Installer Worker
- Fix “Service Host: Local System” from High Disk, CPU & Network usage?
How to Check Memory Usage on Linux?
Memory usage in Linux is typically referred to as the percentage of occupied RAM as compared to the total capacity of RAM available. Good thing is that in Linux there are commands for almost every task as GUI is not available all the times.
Memory usage on Linux is something that is often needed to access to keep a tab on resources and make sure that you are not falling short of required resources for the compilation of tasks that you need to do. We have covered some basic and yet simple commands for you which can you detailed coverage as well as an allocation of memory units on your Linux PC.
free command
It’s the most simple and basic command to display memory usage on Linux. It has some attributes as well such as ‘-m’ which displays all data in megabytes.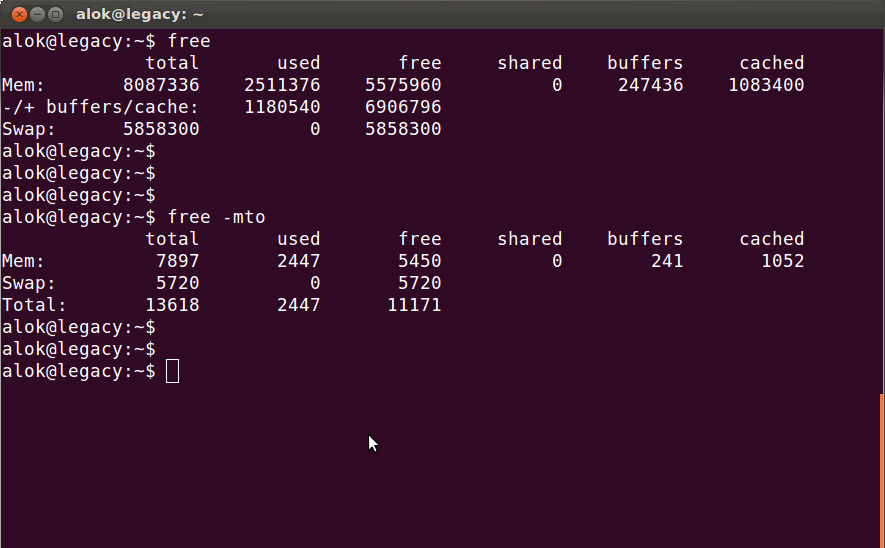
Further attributes and more information regarding it can be found here.
Linux has a habit of caching lots and lots of things for faster processing of information and execution, that’s the memory which can be freed at will if needed. This command also shows the swap memory in the last.
/proc/meminfo
This is a command on Linux reads the /proc/meminfo file. It contains dynamic information about kernel and system. It’s not a real file rather more like a temporary log.
You can compare it with the data displayed by use of the free command, it will be of same value.
vmstat
It’s the command which displays the statistics of the virtual memory being used at the present on any Linux Computer.
It displays the detailed version, i.e. total memory, swap memory etc and others.
top command
This ‘top command‘ is specifically used for memory usage per process but can be used for displaying detailed information about total memory usage and to keep a tab on ram usage on Linux PC.
Just like the free command, it displays buffer and cache as well.
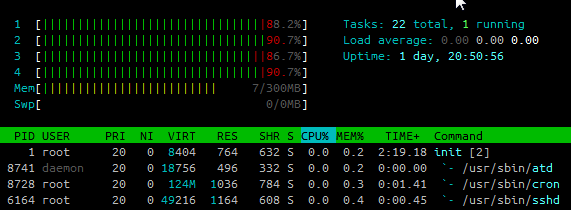
htop
htop command is similar to the top command except for the fact that the header on top of displayed information shows CPU usage statistics and swap usage details with corresponding figures.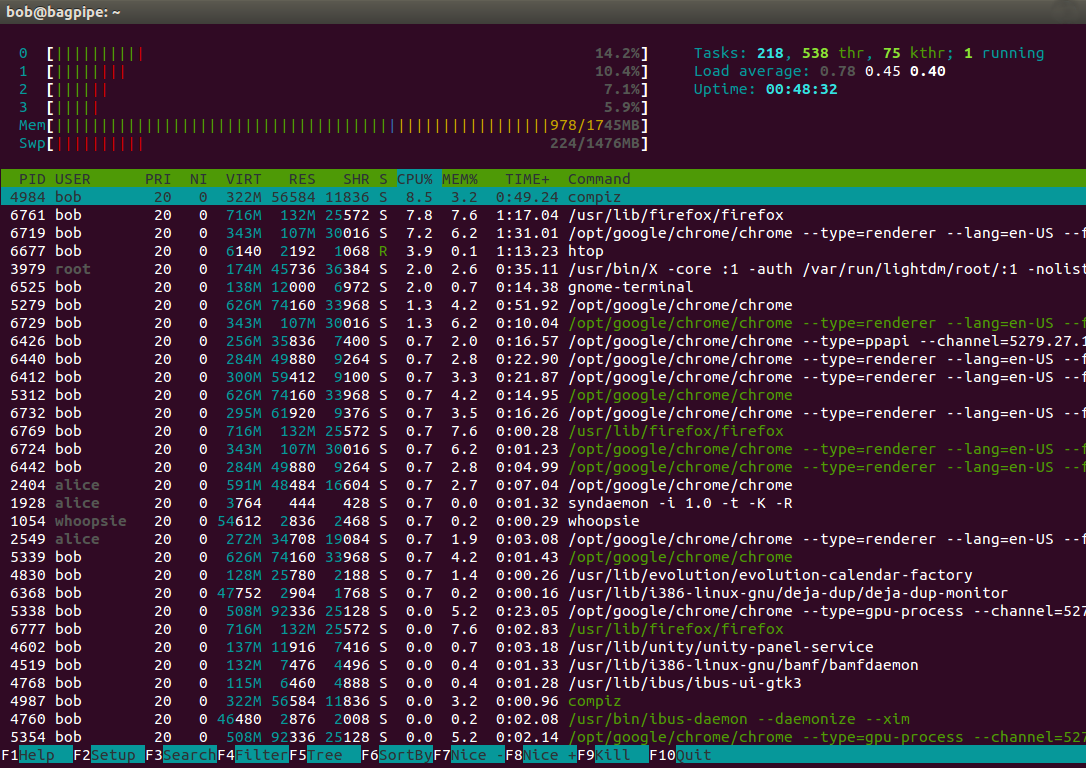
Other than the above, if you need to find out information about installed RAM, then you can use the demidecode command on your Linux. It shows the detailed information about installed RAM.
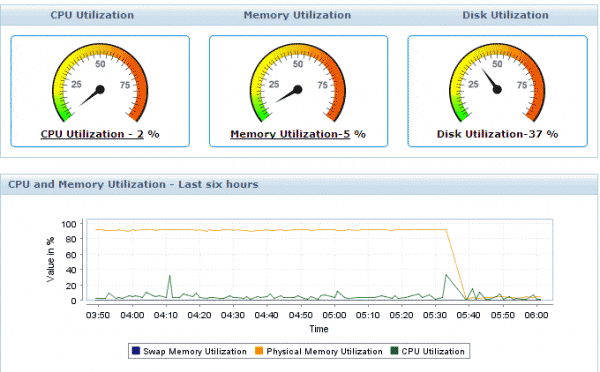
Above all are commands for the terminal but if you prefer GUI interface then it’s much easier to use a GUI based tool. Most commonly used tools are gnome-system-monitor for gnome and ksysguard on KDE.
Both of them provide complete detailed information about resource and usage in a graphical output.
Read Also:
How to Check CPU Usage on Linux?
Linux CPU Usage is the measurement and display of critical information regarding execution of processes and tasks being carried out. Monitoring your system performance and keeping a tab on it is essential for a lot of system related tasks. More than above two, there are several tools as well as commands for Linux which measures as well as monitors and displays system information.
They rely on readings done by the system itself. We will be covering various tools & methods for monitoring and display CPU usage in Linux based distros.
Some other commands such as top, vmstat, htop etc which we covered above show more than one usage information including cpu statistics details of Linux System, so we will skip them introducing again.
Iostat
Iosat command is used for displaying reports of cpu utilization, device utilization, and network file system utilization on Linux System. When executed, it displays the average cpu utilization since last you rebooted your Linux system.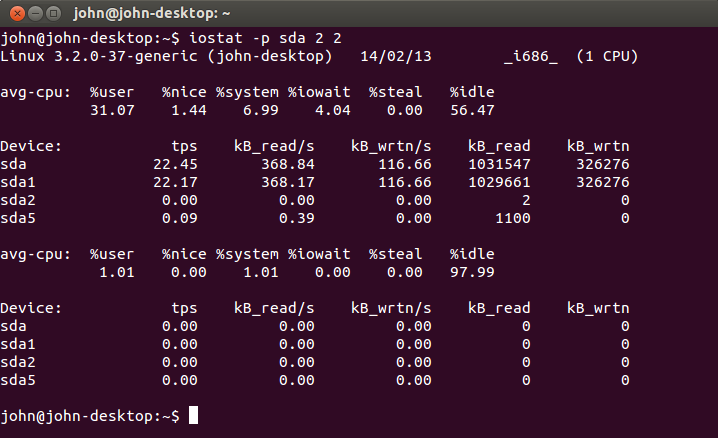
Running the default command will display all three in brief.
To check and see each of them in detailed description mode, use the following attributes.
-c {CPU utilization}
-d {device utilization}
-h {network file system utilization}
Below two attributes are used for display of extended statistics option alongside time duration option as well.
-x {Extended Statistics}
-t {time duration}
Mpstat
Mpstat command is used to report out activities, for each processor that is available. However, if no activity is selected, in that case, cpu utilization report will be displayed on your Linux Screen.
#mpstat command will list global average activities of all CPUs.
#mpstat -P All command will display statistics of all CPUs one by one starting from 0.
Sar
Sar is basically a performance monitoring and display tool for Linux, which can collect and record all the activities of the system all the time. Amongst various statistics that this tool provides, mainly are I/O transfer rates, paging activity, process-related activities, interrupts, network activity, memory and swap space utilization, CPU utilization, kernel activities and TTY statistics.
Check out complete instructions and tutorial on using this tool here.
CoreFreq
It’s another cpu monitoring software which was specifically designed for the 64 bits Linux systems with some specific architectures such as Intel Atom, Core2, AMD family etc. It’s known for its high precision work.
It is comprised of three working parts namely, kernel module, a daemon, and a userland command line interface. You can learn about its full working and usage instructions here.
Nmon
Nmon ( Nigel’s performance monitor for Linux & AIX) was developed by an IBM employee who named it after himself. It’s used to monitor many resources, not just cpu usage. Nigel included the ability to monitor CPU, memory, network, disks, file systems, NFS, top processes in the terminal and included the support for frameworks such as POWER, x86, x86_64, Mainframe and ARM (Raspberry Pi).
Not only monitor, this tool helps the admin to tune and benchmark performance as well for troubleshooting purposes in case of system issues. It uses curses library to minimize the impact on cpu in real-time usage and updates the statistics displayed on screen every two minutes. It uses considerably fewer resources as compared to its peers.
# sudo apt-get install nmon (Ubuntu)
# sudo yum install nmon (CentOs)
Above are the installation instructions for respective Linux systems.
CentOs users though first need to install/enable EPEL repository for being able to install and use it.
After you have launched the tool using ‘nmon’ command, you can display cpu utilization by pressing ‘c’, press it again to hide them.
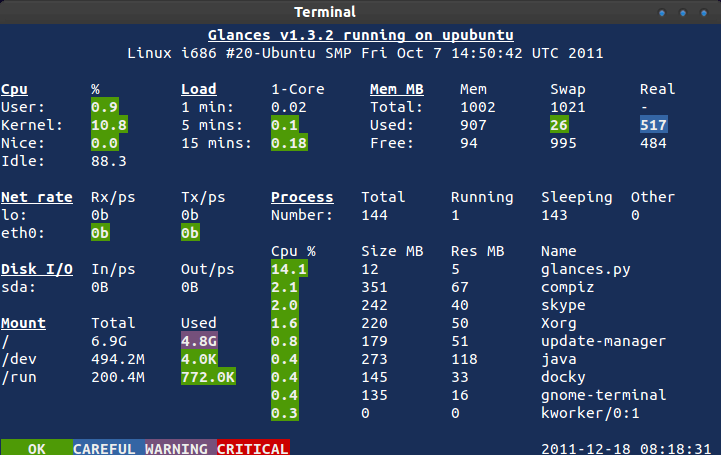
Glances
It’s another curses based cross-platform tool made in python language, it incorporates the use of psutil library for data fetching purposes. Glances monitor CPU, Load Average, Memory, Network Interfaces, Disk I/O, Processes and File System spaces utilization on Linux PCs.
Installation Commands
# sudo apt-get install glances {Ubuntu}
# sudo yum install glances {CentOs}
Usage Instructions
Glances tool can be run in three different modes.
1.Standalone
For purposes of monitoring your local machine, execute the following command.
# glances
2. Client/Server
For purposes of remotely monitoring a machine, execute these steps.
On Server: # glances -s
On Client: # glances -c @server
Here @server is the hostname or the IP address of the server.
3. Web Server
Use the following command steps to run this tool in web server mode.
# glances -w
Cpustat
This tool is just a high-frequency version as compared to others. Cpustat can take measurements of a process every 200ms and provide a summary in 5 seconds top.
You can check the usage as well as installation instructions for it here.
Perf
It is one of the most diverse performance measurement tools out there. Perf can measure CPU performance counters, tracepoints, kprobes, and uprobes that is included in the Linux kernel. It wasn’t like this in earlier versions but since then it has had considerable improvements.
Due to its vast functionality, perf tools are integrated into linux kernel since version 2.6. This utility can be found in Linux-tools package. Read further about its usage here.
Tiptop
Tiptop reads performance counters of hardware and shows statistics of running linux processes. It provides the user with a dynamic real-time view of processes running in the system.
It can be run in live mode as well as batch mode. Both the modes work on a similar basis i.e. periodically querying system for hardware counter values. Learn more about it via this source.
PS command
PS Command can be used to display the cpu usage statistics for each separate process or user on Linux.
Other than that, it can also be used for a host of other functions such as listing, formatting etc. For a better understanding, give this article a thorough read.
dstat command
Dstat is another much versatile tool which is used to generate system statistics of its resources and usage.
You can install it on CentOs and Ubuntu via below commands.
# yum install -y dstat {On CentOs}
# apt-get install dstat {On Ubuntu}
Further details regarding its usage and specific attributes can be found here.
Above in the article, we tried to cover all the command line tools as well as graphic user interface software which are best recommended as well as popular when it comes to measuring and monitoring the Hard Disk Usage, Memory Usage, and CPU Usage on Linux PC. If you have some query that is left unsolved or any suggestion, then let us know in the comment section and we will get back to you without ado.